Offer / Filter: sample
Sample Analysis: Number of Games at 1st Set at Clay Tournaments + Odds Range
This page would like to illustrate how to use several Trefik features at the Offer window. The create analysis has no big goal to find any sure winning strategy. The main task of this text is just to show which funtions can be used at the Offer window and how to use them.
Let's try to analyze the total games number at the first set at matches played at the clay tournaments. We also should analyze the odds dependancy of this games summary.
The most of analysis could be done at the Offer window. We will create a simple filter, create a new column and check the results.
First we should set up Trefik into the design mode OFFER (this option can be activate at the right bottom corner of the main Trfik window). The starting situation could be as this:
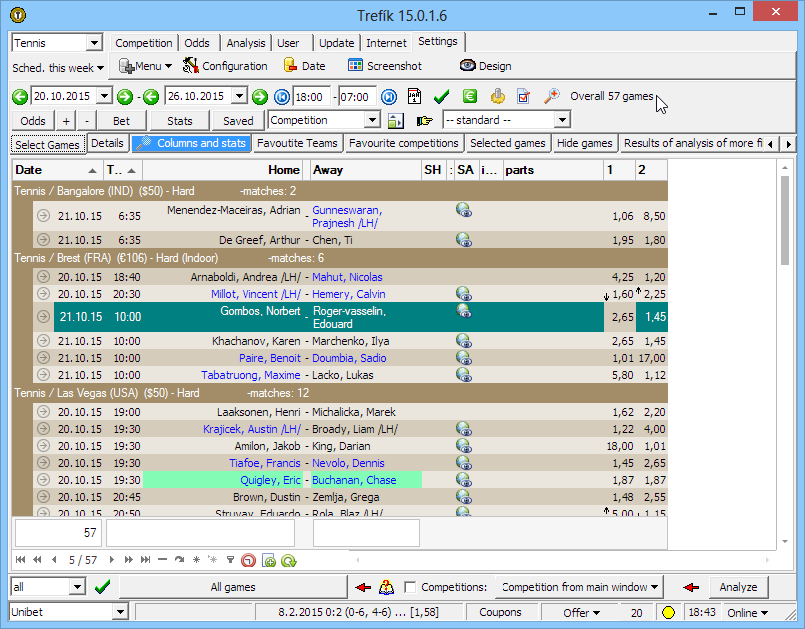
(the picture shows the Offer design mode, Tennis is selected at the top left corner and the active period is "Scheduled this week" - it means the window displays the scheduled tennis matches; the section "Columns and stats" has the active option ONLY WITH ODDS .. an active section is announced with the marked section heading).
Now we will create a simple filter. First we must change the otpion ALL at the left bottom corner to the option FILTER. Right to this option there is the active filter name. Right to this area there is the button for editing the filter settings. This button is marked by the mouse cursor at the following picture:

By clicking that button the window for the filter definition appears:
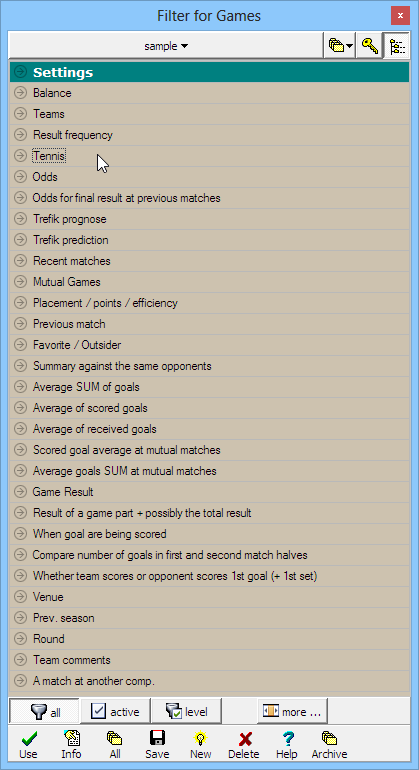
.. if the option ALL at the left bottom area is active then all the filter sections are visible at the top (as at the picture). To solve our task we need to use just the section TENNIS (with the curson at the picture).
By clicking at the TENNIS section this section expands. Then we need to expand also the subsection WHICH TOURNAMENTS:
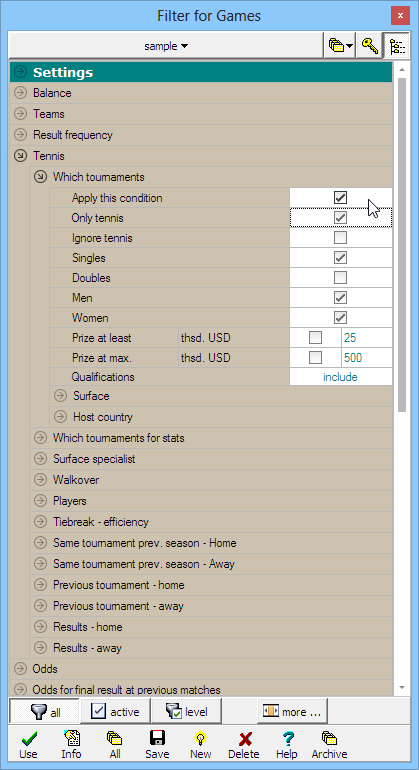
.. we shall active the following options at this section:
- APPLY THIS CONDITION - in order to take into account the other active conditions from this section,
- ONLY TENNIS - our filter will work just and only with tennis matches,
- SINGLES - we wish to work just with the singles tournament, not with the doubles,
- MEN + WOMEN - we will analyze both men and women tournaments.
It is also needed to set that the filter works only with the CLAY tournaments. We can use the section TENNIS / WHICH TOURNAMENTS / SURFACE:

.. just the option CLAY should be active here. Then we should save the filter settings using the button at the bottom.
The following picture shows the ACTIVE option at the filter window. It means just the active sections are visible. The Settings section is expanded:
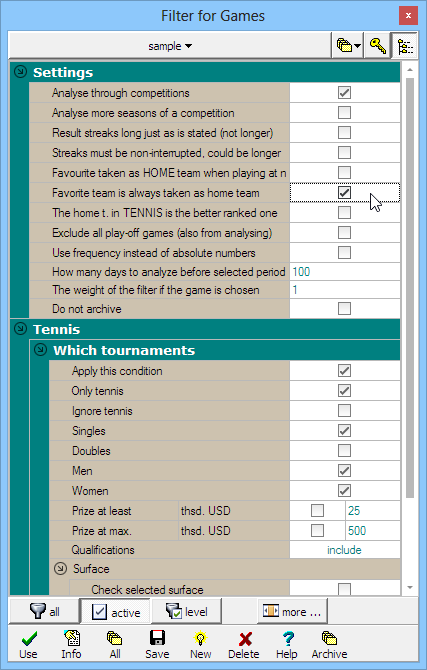
.. for tennis matches it is very recommended sometimes even needed (it the conditions for home / away teams are active) to activate the seetings "Favorite is taken as home team (it means to be stated as the first team). In our case we wish to analyse the odds level. So this "favorite" settings is very suitable for us. The favorite tennis player is that one which has the lower odds. So if we wish to analyse the matches with odds around the value 1.30 then it is enough to analyse these odds for the prediction 1. As the favorite player is stated as the first player the odds level 1.30 can never be at the prediction 2 (only the outsiders are there). If we would let this option inactive the order of players would be the same as at the selected bookmaker offer. And that can be different for different bookmakers.
Then we need to define the new column. There will be counted how many games were played at the first set. To define the new column we have to press the button MORE at the right bottom part. Then the new bottom part of the Filter window appears - new options for the filter settings would be visible:

The button EDIT at the row COLUMNS opens the new window for the colummns definition:
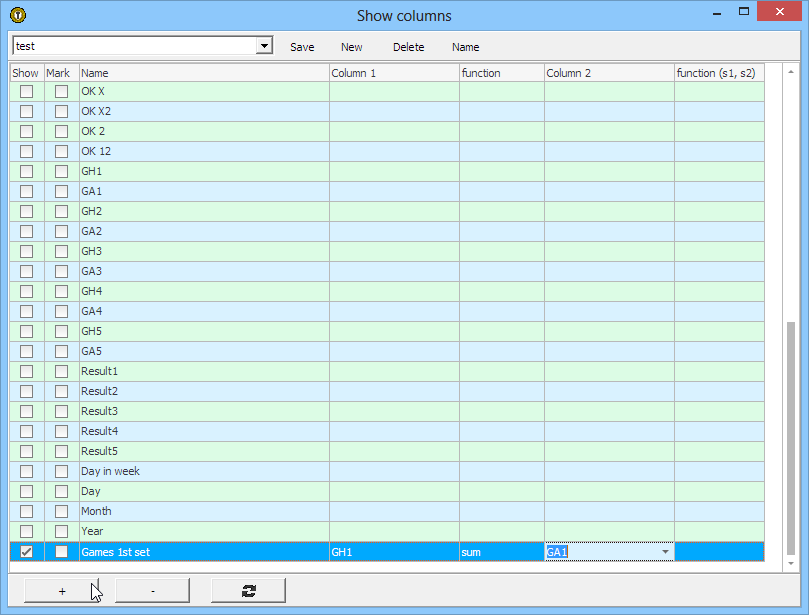
.. the button PLUS at the left bottom area was used for adding the new line (= the definition of the new column at the Offer window). The name was entered as "Games 1st set". The new column is defined as the SUM of the columns GH1 and GA1 (those columns are equal to the number of goals /games in tennis/ for the home / away team at the 1st part of the match /half, period, quarter or set in tennis/). The column FUNCTION must contain the value SUM and the columns at left and right must contain the values GH1 and GA1 (listed from the drop-down menu).
In order to display the games from 1st set it is necessary to activate the option at the Offer window at the mouse right button menu: Settings / Set results display as match parts. This option is not active by default as it causes some slowening the Offer window.
After saving the new column definition we need to activate using it at the Filter window. The complete filter looks like this then:
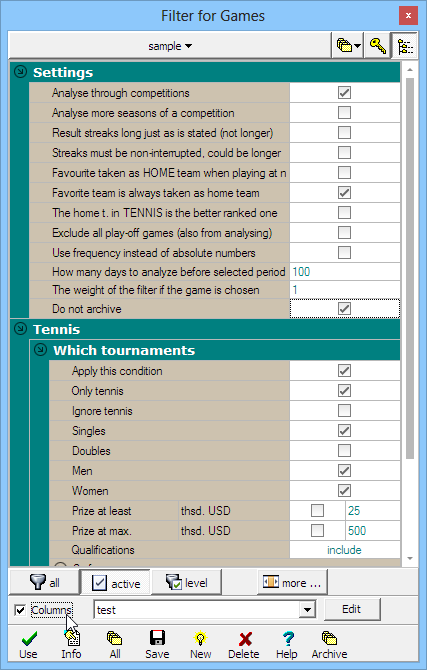
We can use the created filter at the Offer window now. We must set the date FROM: 01/10/2015. If the new columns are not visible we need to use the button for resetting the columns settings (marked at the picture):
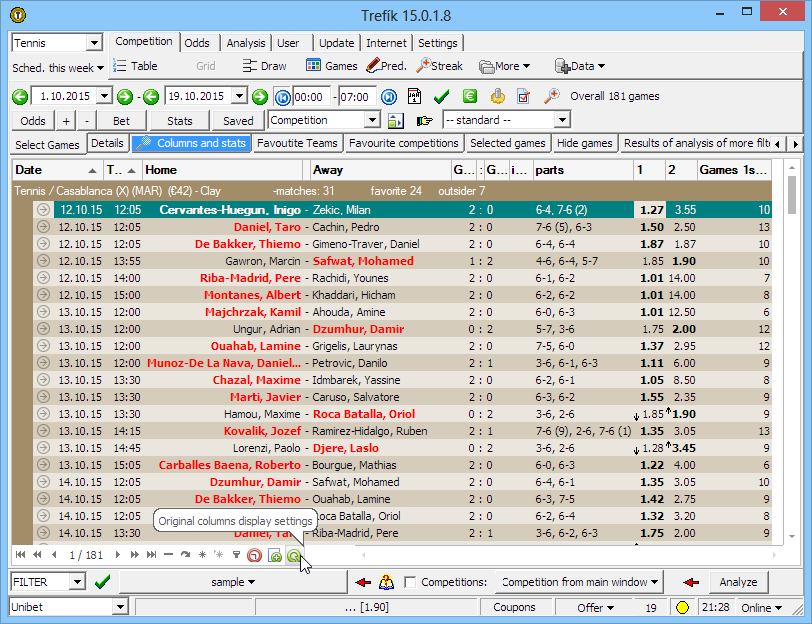
.. at the first sight the filter works well. The favorite players (with lower odds) are always stated at the first place, the new column contains the properly counter number of games at the first set.
So we can apply that filter for a longer period: since 01/01/2014 (set at the left top area):
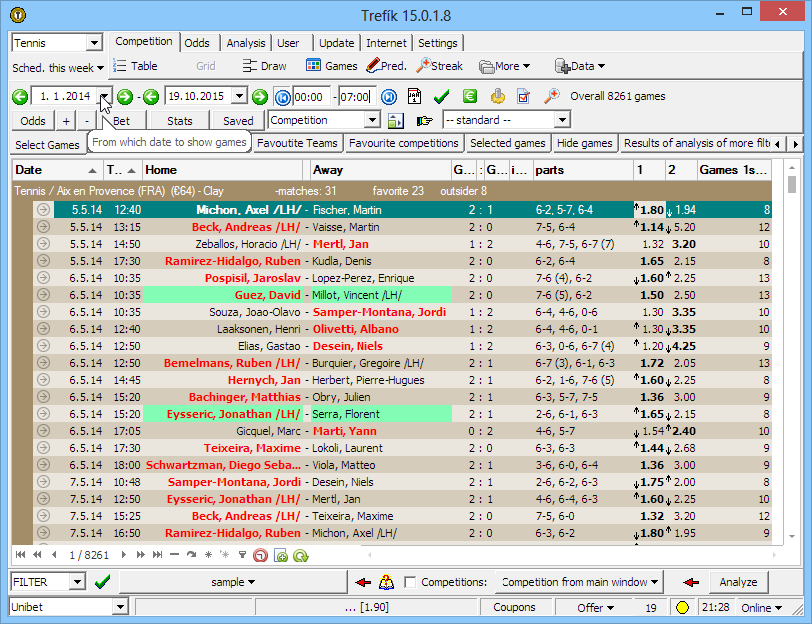
... we have more than 8 000 matches which is quite enough for analysing the situation from our task.
To get the analyze data we can use the button STATS at the upper part of the Offer window and the feature CHART. The new window is opened and we can select the value "Games at 1st set" at the upper area - to watch the values at the new defined column:

Then we need to set which values should be visible at the chart. It is suitable to define the listed values from 6 to 13 (that is which the sum of the games cound be). We must write these values at the row divided by "/". After clicking the COUNT button we can see:
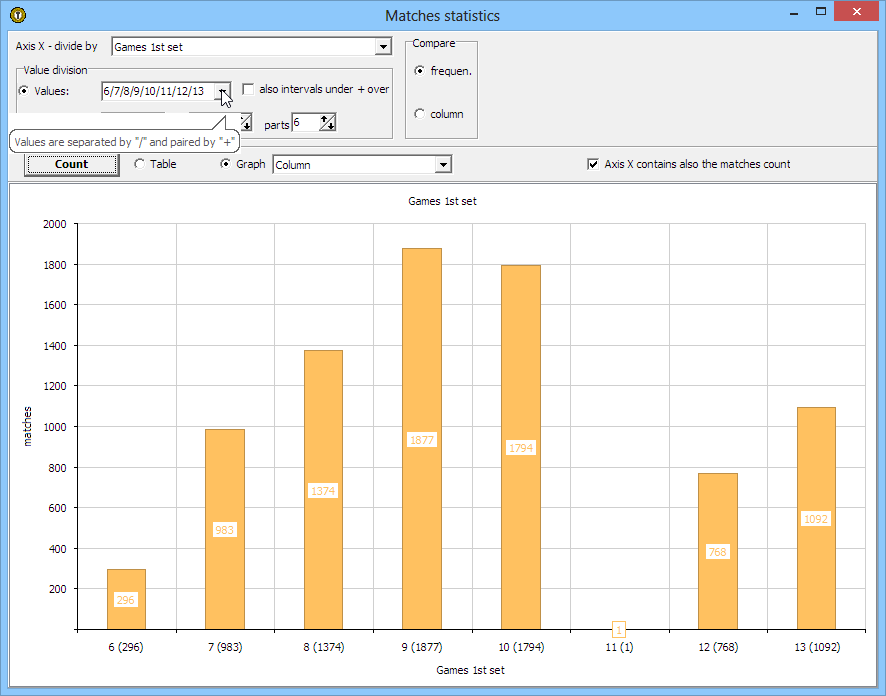
Everything looks fine at the first sight. The most common sum of games is 9.
But the second sight can warn us there is a problem at this statistics. The sum of games equal to 11 can only happen if the match was not finished properly (= if a player retired during the match). It would be a good idea to eliminate those matches from our analysis.
First we should check at the Offer window that the sum of the games equal to 11 means really the match where a player retired. The fastest way to check this is using the "fast filter" by clicking at the column heading (at the column with the sum of games). We need to click at the right upper area of this heading. Then the list of all available values appear .. and we can filter just the value 11:
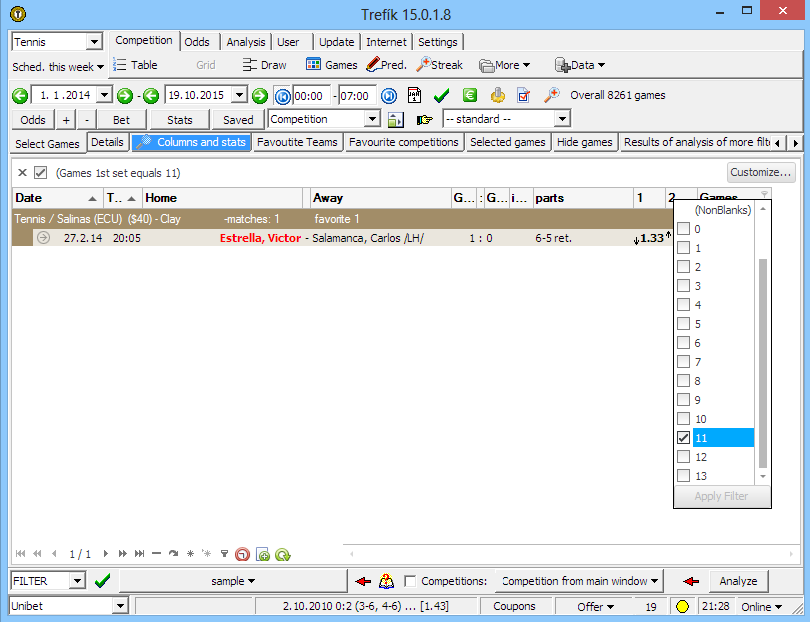
.. so we can be sure that there really was a match with a retired player. We can see now that the matches with a retired player can be quite common in our selection of matches .. so it would be really a good idea to eliminated them from our task.
The matches with a retired player are stored in Trefik the way that the result is always 1:0 for the winning player. So to eliminate those matches we need to eliminate the results 1:0 from our matches selection. The easiest way would be when using the sum of sets at the whole match. If this sum is equal to 1 then we need to eliminate that match..
First we should create the new column at Filter / Columns. The sum of "home goals" and "away goals". In tennis those values are equal to the won sets for 1st and 2nd player.
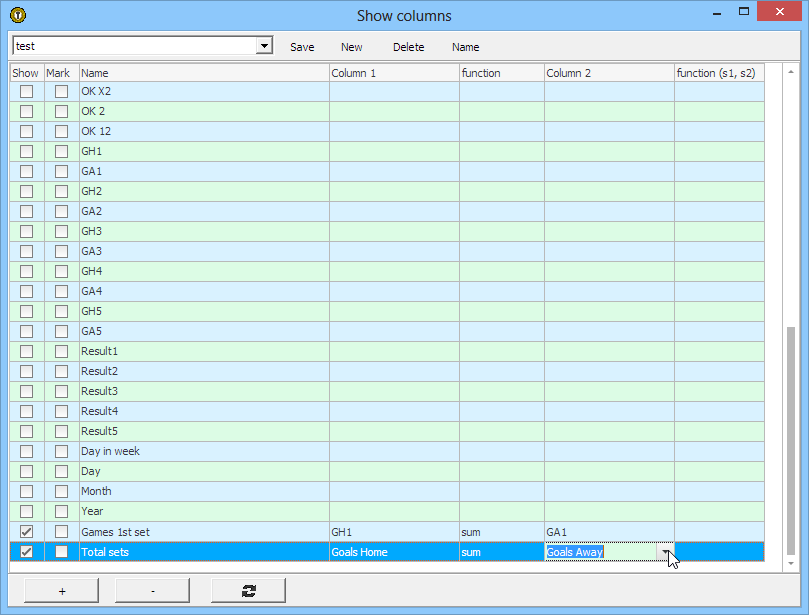
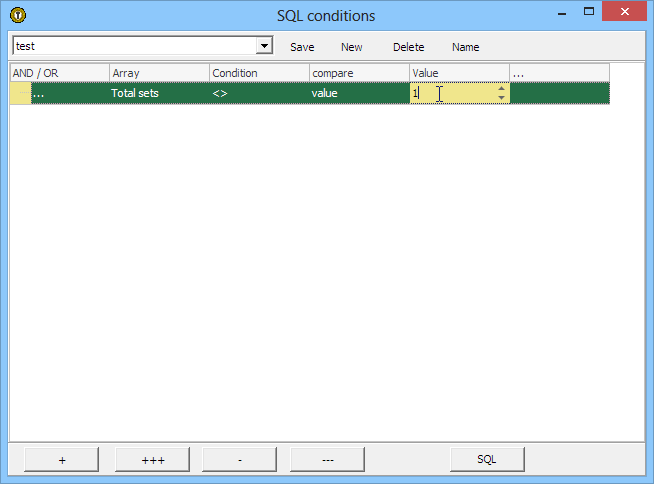
Then we need to use the section Filter / Conditions:

.. and activate the condition for eliminating the matches where the column "Total sets" value is equal to one:
After using that modified filter at the Offer window:
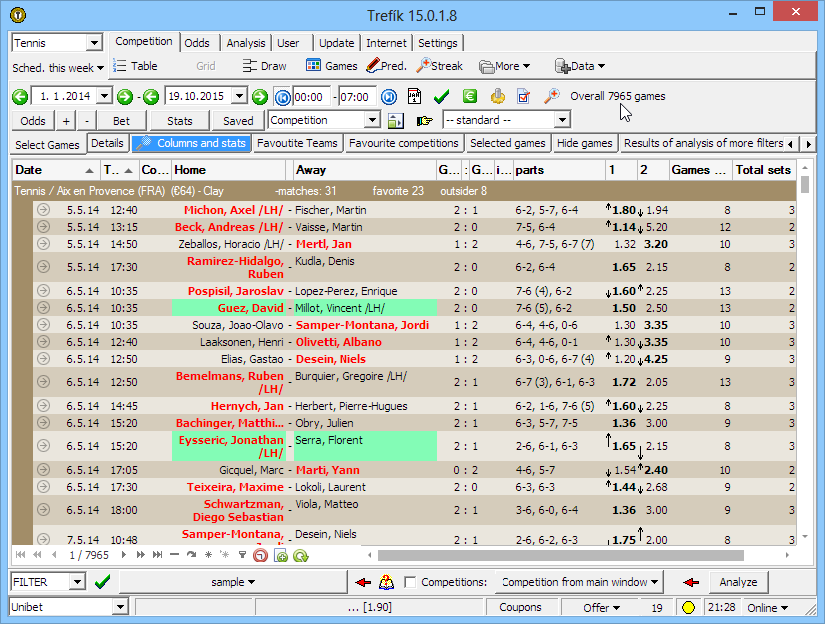
.. we have for about 300 matches less - all those matches were retired.
Stats / Chart then looks like at the picture:
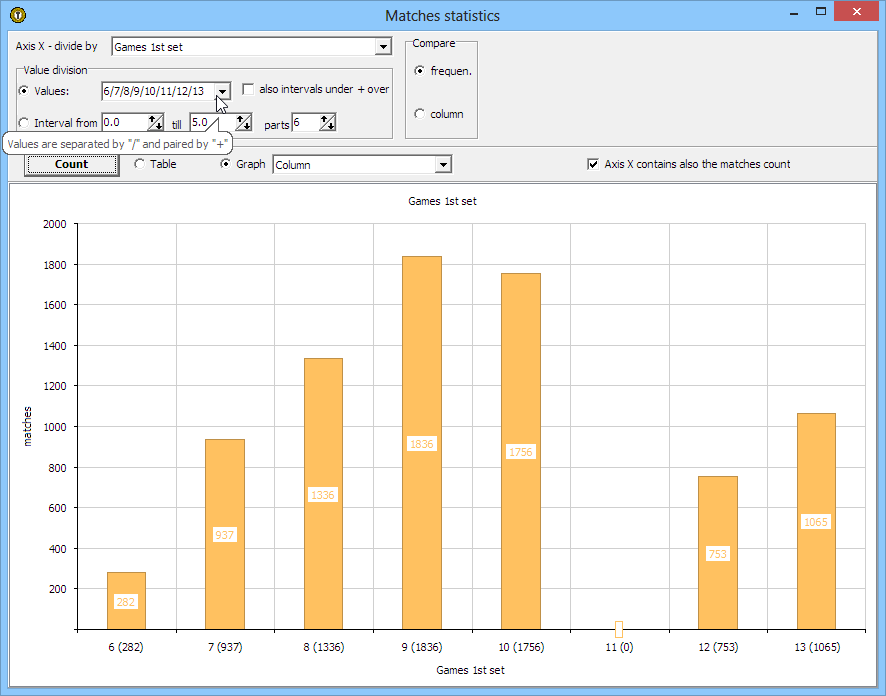
We can try to filter the matches according to the odds for the favorite player now. First we can filter the matches with the odds range 1.25 - 1.35. We can make it similary to filtering the sum of games (equal to 11 earlier at this text) - by clicking at the top right part of the column heading with odds for 1. We can click at the option DEFINE and the following window appears:
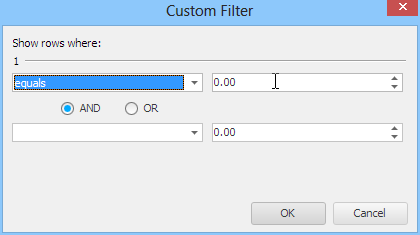
We need to fill the values this way:
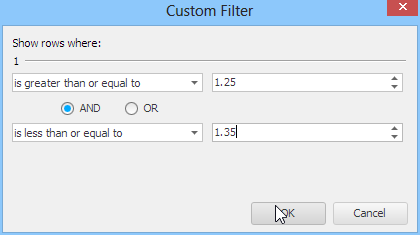
After confirming the entered definition by the OK button the Offer window looks like this:

.. the number of "fast filtered" matches is displayed at the left bottom area (see the mouse curson).
Stats / Chart then looks this way:

The number of games at the first set can be examined more. Using the mouse right button menu at the Offer window we can activate two options: "Show footer with numbers" and "Show footer with numbers at groups". Then by clicking mouse right button at that footer (both of them) at the column "Games 1st set" we can activate the option AVERAGE:
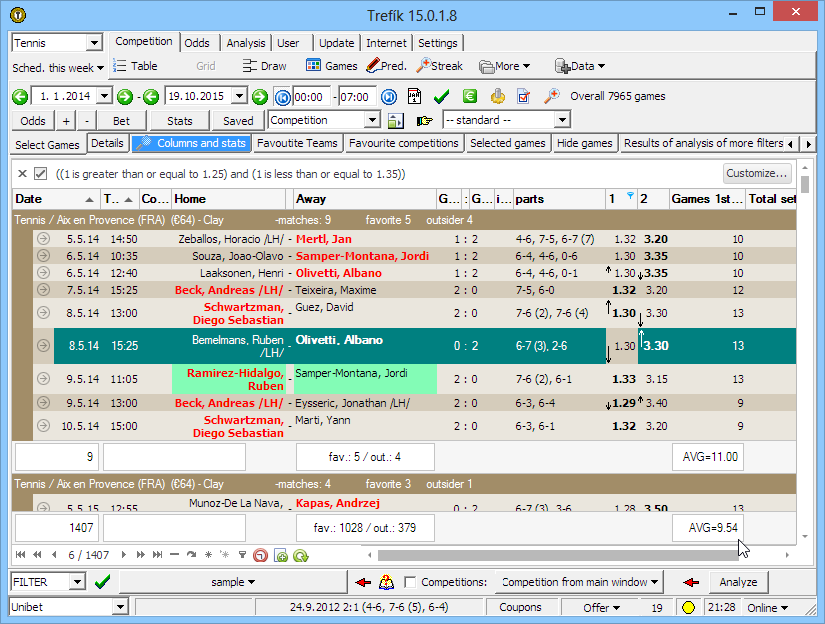
.. the bottom value always shows the total value for all visible matches. The upper value is always counted just per one group (per a tournament at our sample).
Now we cancel the fast filter for the odds range limit:
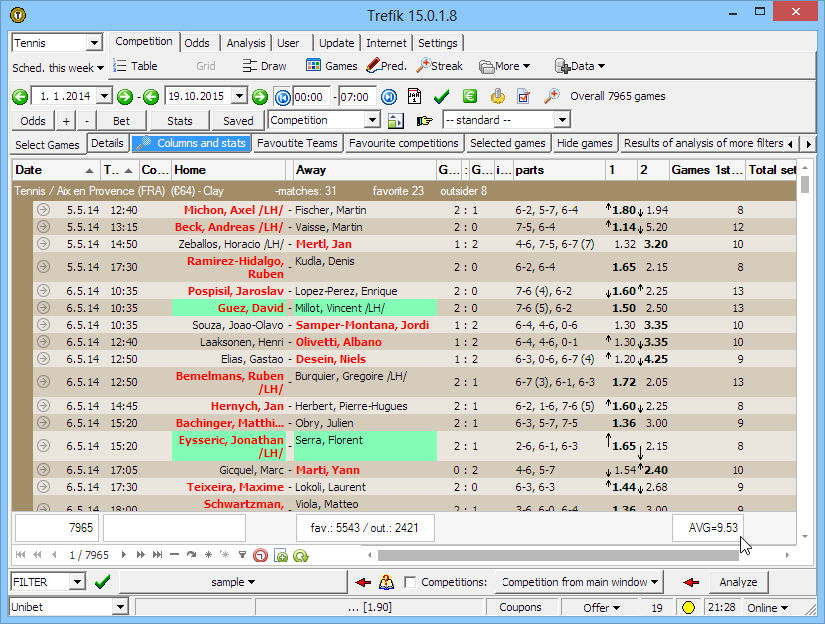
.. and we can see that the AVERAGE value is about the same.
Now we can try to check the dependency of the odds and the average games number at the first set. It would be nice to have the matches at the groups not by the tournament (as we have now) but by the odds value. Then we would get automatically the counted average number of games for every odds group.
Trefik allows to complete also this task (grouping by odds). So let's check the way how to make it.
A possibilty is creating the groups for each and every odds value. It would be just simply grouping not by the tournament name but by the selected odds value.
To change the grouping columns we can use the button at the upper part of the Offer window. The following picture shows that button at the "clicked" mode:

.. the default settings is the competition (= tournament) grouping. The active grouping columns are displayed at the new row above the matches list.
When we wish to group by a different column it is necessary to click at the heading of the selected column and drag+drop it onto the new top row at a selected place (left to the Competition panel in our case). Then the situation looks like that:
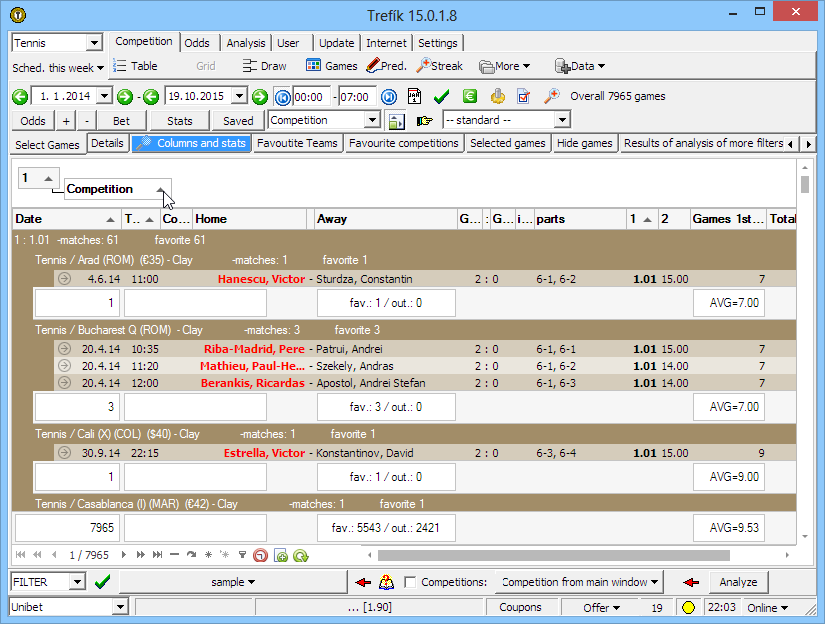
That is really a nice match grouping but it is not exactly what we wanted to see. The matches are grouped according to the odds but still also according to the competitions (= tournaments). We should eliminated the tournament grouping. We can make it by drag+drop of that Competition panel back into the matches list. If we move it at the first position at the matches list then the situation is:
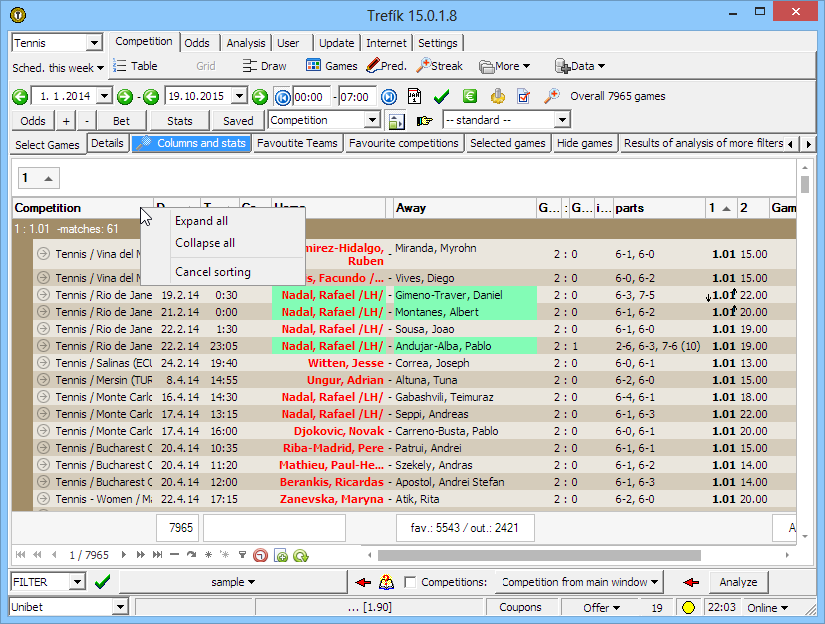
.. the picture shows also the menu which is displayed after clicking the mouse right button at the columns heading. The option COLLAPSE ALL can hide all the matches and just the group headings would be visible then:

.. also the footers with the counted averages are visible. So we can compare the values.
BUT. We would appreaciate much more if the matches are not grouped by the exact odds values but grouped by the odds value ranges (intervals). One group would be for the odds from 1.01 to 1.10. Other group would be for odds 1.11 - 1.20. And so on (or with completely different range settings). Trefik allows you to define also this grouping.
The new column would be needed. That new column will contain the values which will be used for the grouping. It means that new column values must mirror the odds for the favorite tennis player somehow. Every defined odds range must assign the defined value to the new column. For example the odds range 1.01 - 1.10 would be represented by the value 1. The odds range 1.11 - 1.20 would het the value 2.
We need to use the section Filter / Columns to create a new column:
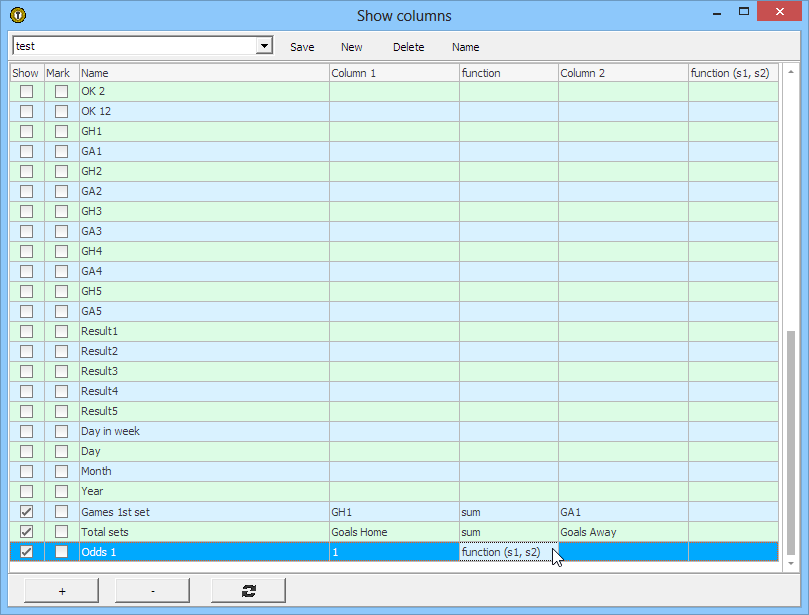
.. after clicking the button PLUS the new row for defining our new column was added. The name can be set manually: ODDS 1 at our sample. The column values are defined using the odds at the column 1 (odds for the first tennis player = the odds for the favorite tennis player). The column FUNCTION at the column definition must contain the value "f (s1, s2)": it means the column value is defined by a function having up to two parameters. The function defition must be created at a separate file. The file must be manually created at the Trefik/CSV folder (we need to create the folder CSV if it does not exist yet). The file must have the extension FUN. It is possible to use the Windows Notepad to create that file. The file must be created this way:
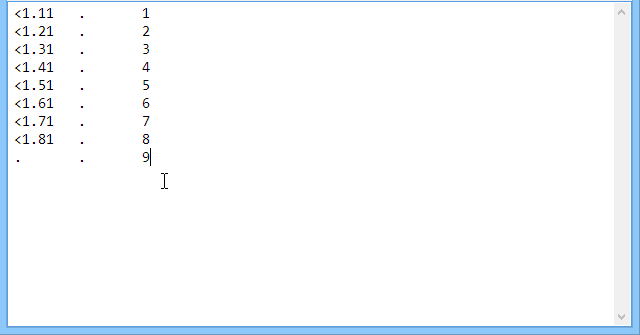
.. the file contains three columns. The first column is related to the first parameter from the new column definition. The second column at the file is related to the second parameter. The third column contains the value which would be returned by the function if the conditions for both columns are fulfiled. The column values at the definition file must be separated by TABs.
The first column at the file contains comparing with the odds. To compare the values the symbols "smaller", "higher", "equal" and "exclamation" (= not equal to) can be used. It is not possible to use the symbols "higher or equal" neither "smaller or equal".
The second column contains only the values "dot". That means it does not matter at this column value.
The third column contains the values 1 till 9. These values would be returned by the function. In this case the returned value would depend just at the first column. The rule is that if a row at the definition file is fulfiled then Trefik does not continue to the next rows. It means the value 1 is returned for the odds 1.10 not matter that this odds value meets also all other conditions for the first column.
After creating and saving the FUN file we can reopen the window for the column definition. Then the created file is at the drop-down menu and we can save the definition this way:

The Offer window after reseting the columns settings (clicking at the right part of the bottom button .. after proceeding a change at the column definition it is needed to reset the columns in order to see the new column) and after grouping the matches accoding to the new column ODDS 1:

.. at the heading of each group we can see the value of the new column ODDS 1. These values are defined at the created FUN file.
We can see that the average games number at the first set is increasing together with the odds value for the match favorite..
The goal of this sample was not to find any winning betting strategy. The only goals of this sample was to use several advanced Trefik funtions for data analysis. The similar steps can be used in other betting strategies and can help users to find their winning strategy.