Match Course in Details
The course of matches: goals, corners, score equalization, turning the result of the match
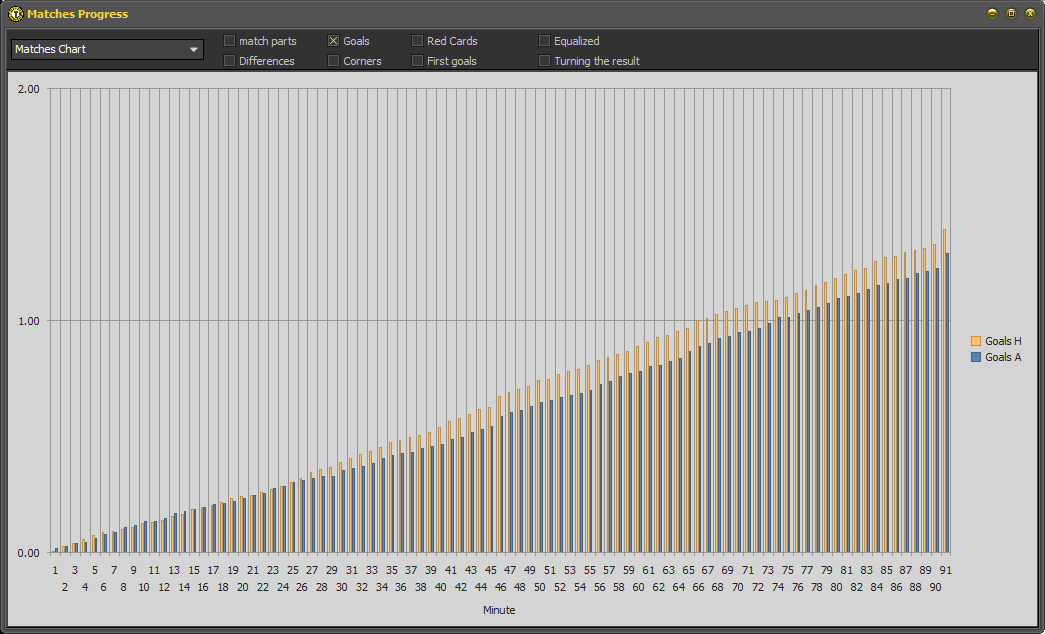
A new function is now available in the Offer window: for football and hockey matches, the course of the matches can be analyzed in detail in minutes. The new window can be displayed using the STATS button and the Match Progress option. For the Premier League and the data for several months, the course of the number of goals looks like this:
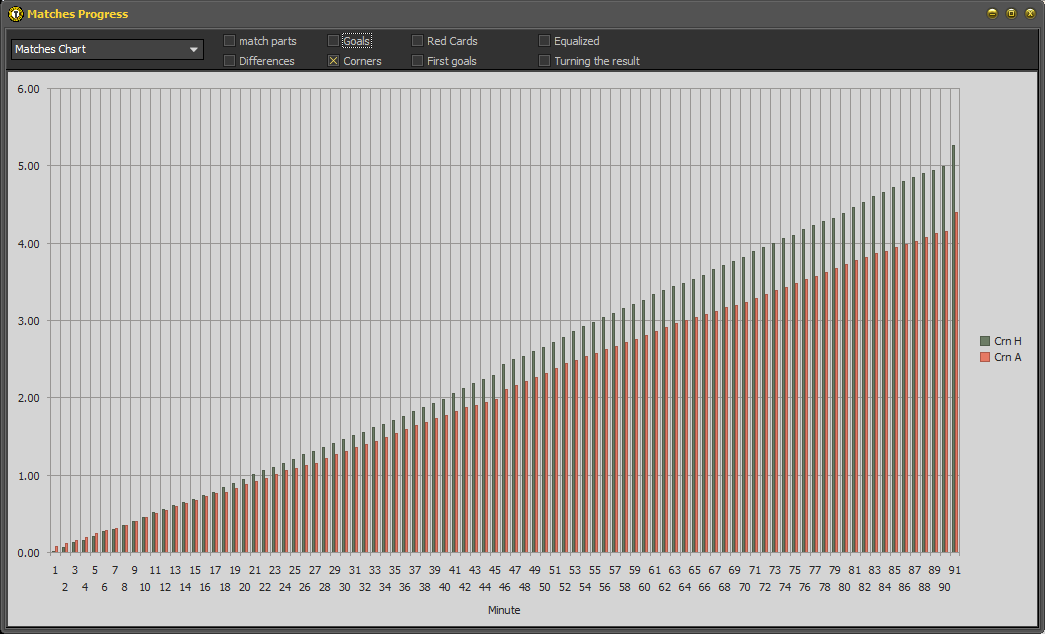
The distribution of corners at the time of the match between the home and the guests is as follows:
The next graph shows data on the first goal scored in the match:
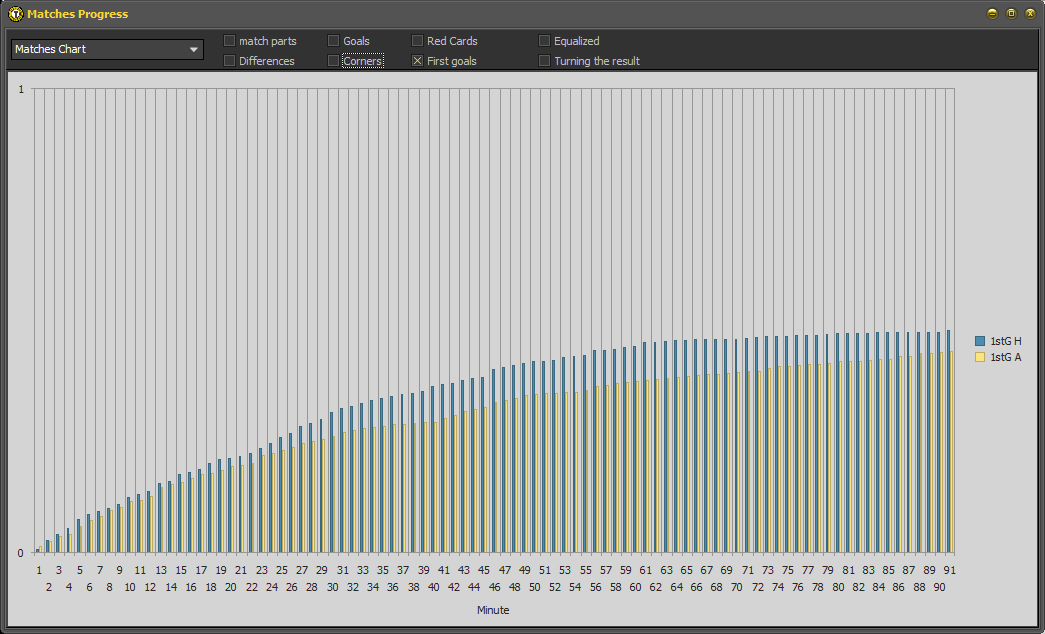
The new functions are mainly used to analyze the selection of matches in the Offer window. Such a selection may be the result of the use of a filter. We can then examine how the course of the match corresponds to the development of the expected overall result.
Other graphs are based on the matches of the Premier League, but with a selection of only those matches where the odds at home were at most 1.80. The home team was the favorite in these matches. Again, the course of goals scored, corner kicks and the first goal in the match is shown:
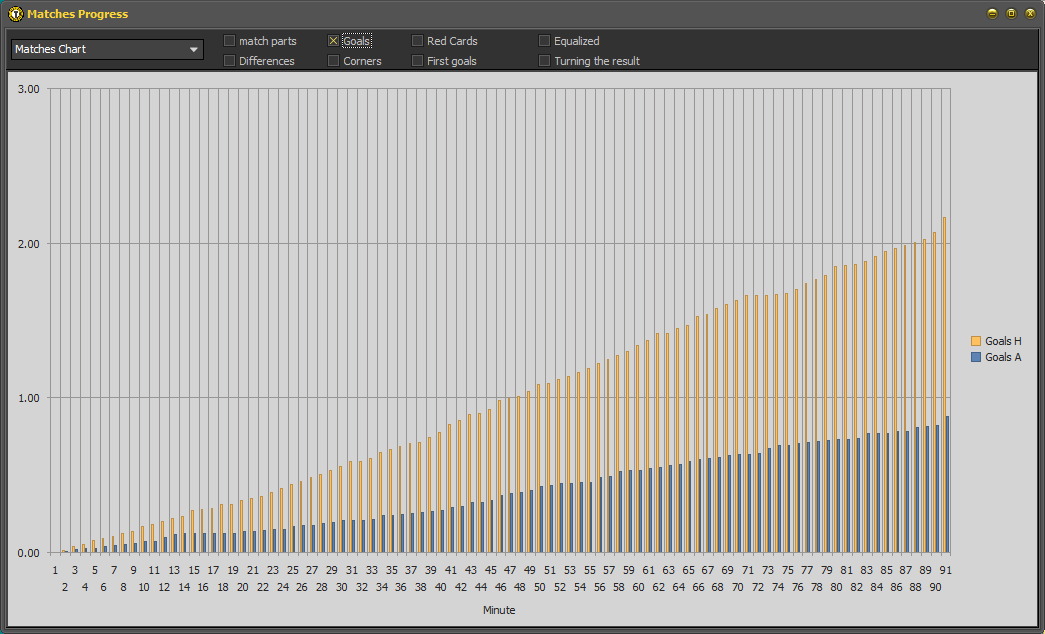
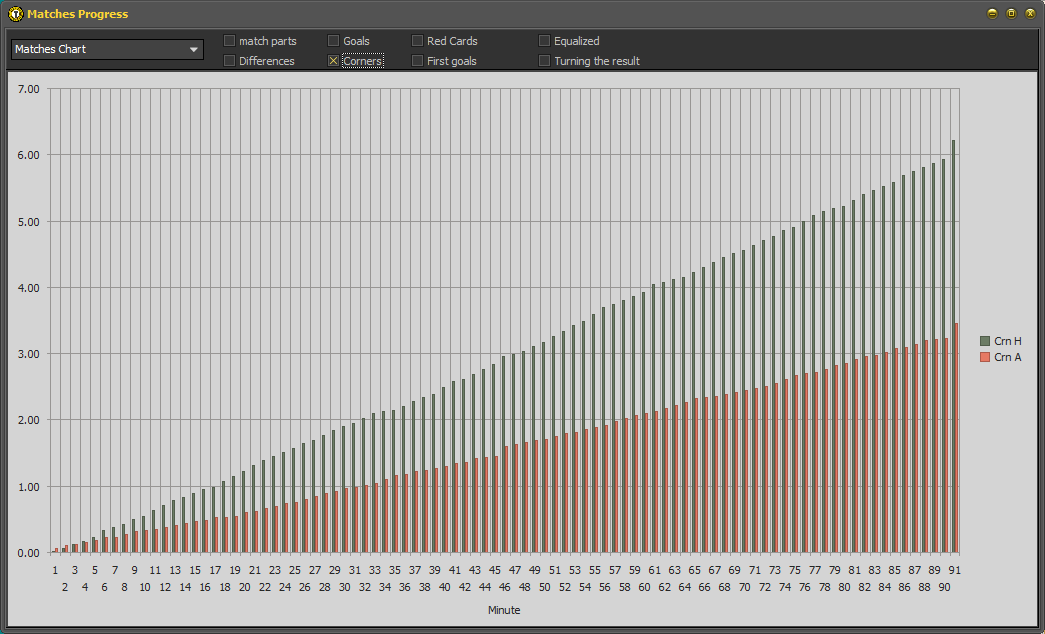
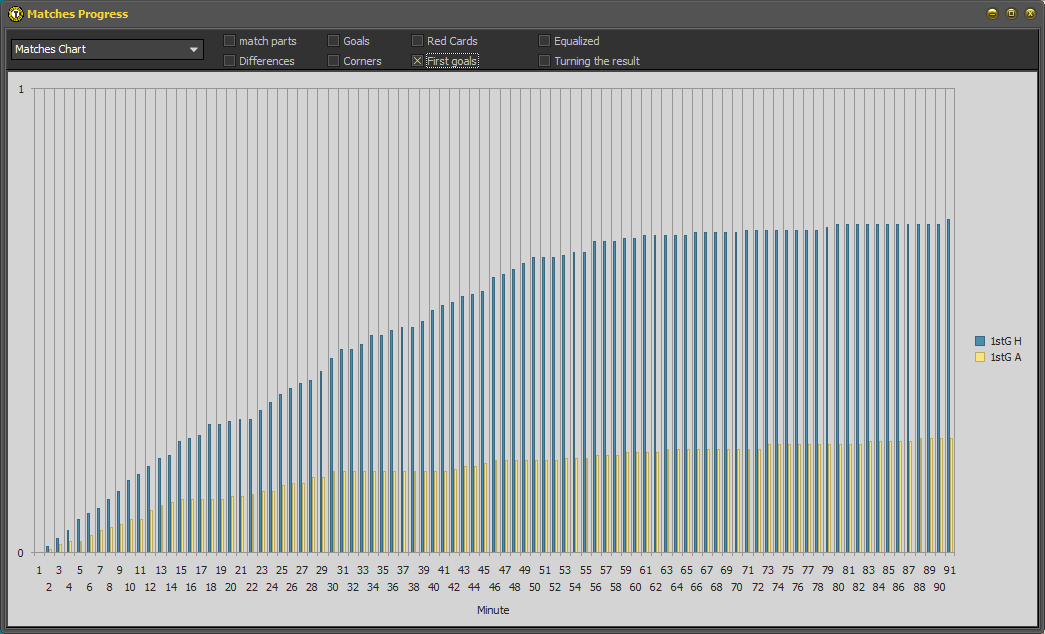
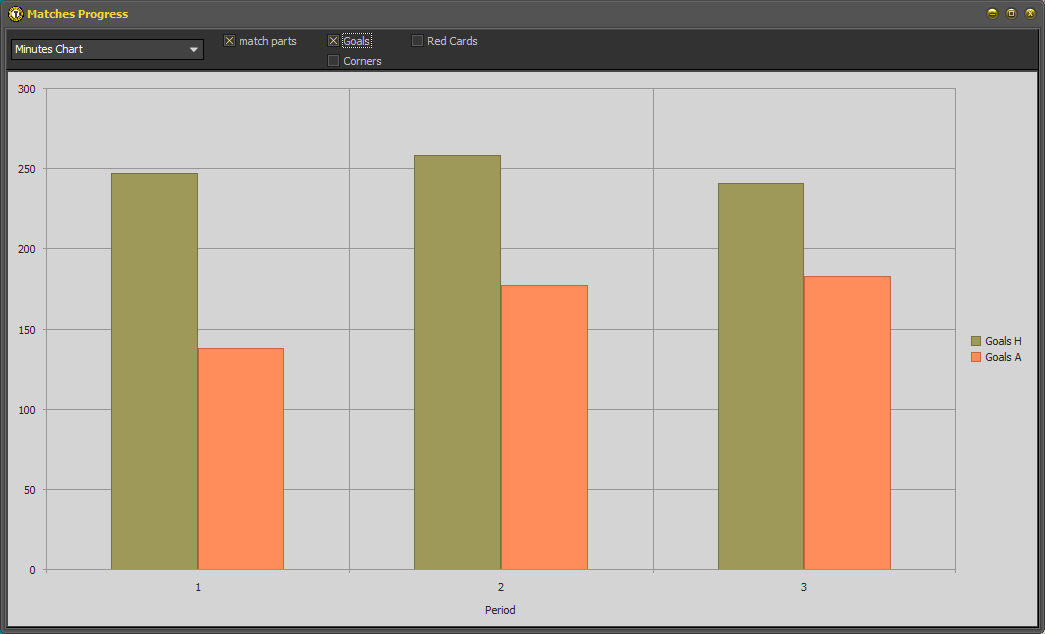
Another picture comes from the data of ice hockey NHL. Captures the distribution of goals by thirds:
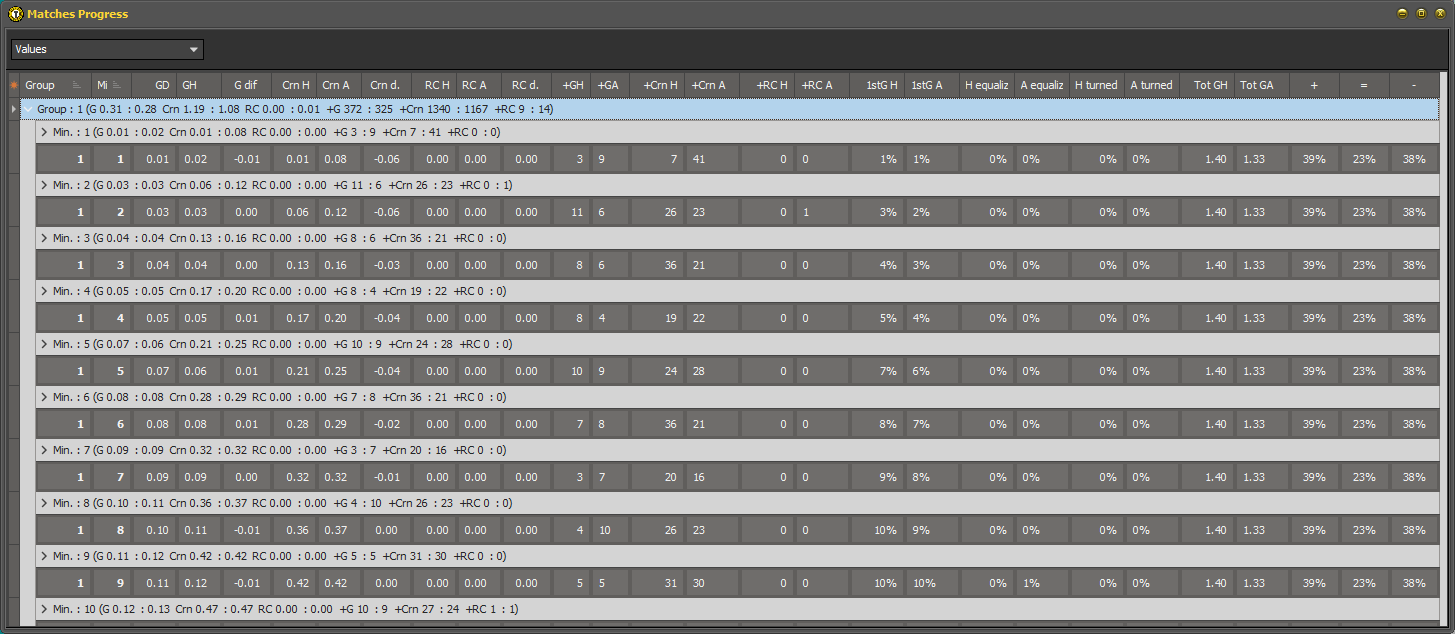
Match data can also be displayed in tabular form. The data in the picture are grouped by minute of the match. Each minute shows the average score at that time, the difference in score, how many goals the home team and guests scored in that minute (columns +GD and +GH), the distribution of the first goal in the match and how many matches the team managed to score. to compensate for the hitherto unfavorable result or even to turn it in its favor:
